

7 Ways to Build a Python AI Business Intelligence Dashboard
A Python AI business intelligence dashboard combines data modeling, a FastAPI service, machine‑learning inference, and visual‑analytics tools to turn raw information into actionable insights. By defining clear metrics, securing the pipeline, and deploying scalable components, organizations can move from data to decisions efficiently.

How to build a Python AI business intelligence dashboard?
- Clarify goals and KPIs – Identify the business questions you need answered and list the data sources that will feed those metrics.
- Design the data model – Choose a storage solution that supports fast aggregations, normalize tables where needed, and create a schema that reflects the KPI definitions.
- Create a FastAPI backend –
- Define REST endpoints for raw data retrieval and for model predictions.
- Use Pydantic models to validate inputs and outputs.
- For implementation details, refer to the official FastAPI documentation, which covers routing, request validation, and API development.
- Integrate machine‑learning models – Train a predictive model on historical records, serialize it (for example with joblib), and load it inside the FastAPI route to provide real‑time scores.
- Connect a visualization layer – Export JSON or CSV from the API and bind it to a BI platform such as Tableau, Power BI, Looker, or a pure‑Python solution like Plotly/Dash.
- Embed security controls – Apply OAuth2/JWT for authentication, encrypt data at rest, and enforce role‑based access to sensitive fields.
- Deploy and scale – Containerize the FastAPI service, run it on a managed Kubernetes cluster or similar orchestration, and enable auto‑scaling based on request latency.
Following this pipeline results in a functional Python AI business intelligence dashboard that delivers predictive insights while remaining maintainable and secure.
How does FastAPI improve scalability for business intelligence dashboards?
FastAPI leverages asynchronous Python and runs on the Starlette framework, allowing a single process to handle many concurrent I/O‑bound requests. Key scalability advantages include:
| Feature | Impact on BI dashboards |
|---|---|
| Async endpoints | Low latency when pulling large datasets or invoking model inference |
| Automatic OpenAPI docs | Faster onboarding for front‑end developers and analysts |
| Dependency injection | Clean separation of database connections, caching, and model loaders, simplifying horizontal scaling |
| Built‑in validation | Fewer runtime errors, keeping the API stable under load |
When paired with container orchestration, FastAPI instances can be replicated across nodes, keeping the dashboard responsive as data volumes increase.
Benefits of a Python AI business intelligence dashboard
- Predictive insights – Embedding machine‑learning scores directly into the dashboard lets decision makers see forward‑looking risk or opportunity indicators.
- Rapid iteration – Because the backend is written in Python, data scientists can update models or add new features without rewriting large codebases.
- Scalable architecture – FastAPI’s async nature and container‑friendly deployment enable the solution to grow with traffic spikes.
- Secure by design – Integrating authentication, encryption, and role‑based access from the start protects sensitive financial or e‑commerce data.
Learn more about Data & business intelligence expertise.
These advantages help organizations turn raw data into strategic actions more quickly than with static reporting tools alone.
Which visualization tools integrate best with Python for BI dashboards?
| Tool | Integration method | Typical use case |
|---|---|---|
| Tableau | Web Data Connector or CSV/JSON export | Interactive, drill‑down dashboards for senior management |
| Power BI | Python script visual or REST API push | Enterprise reporting within the Microsoft ecosystem |
| Looker | Looker SDK + Python client | Custom data explorations embedded in SaaS products |
| Plotly/Dash | Pure Python, server‑side rendering | Fully custom, web‑based dashboards when branding control is critical |
Select the option that aligns with existing analytics stacks and meets security requirements.
Can custom software development shorten ROI for AI dashboards?
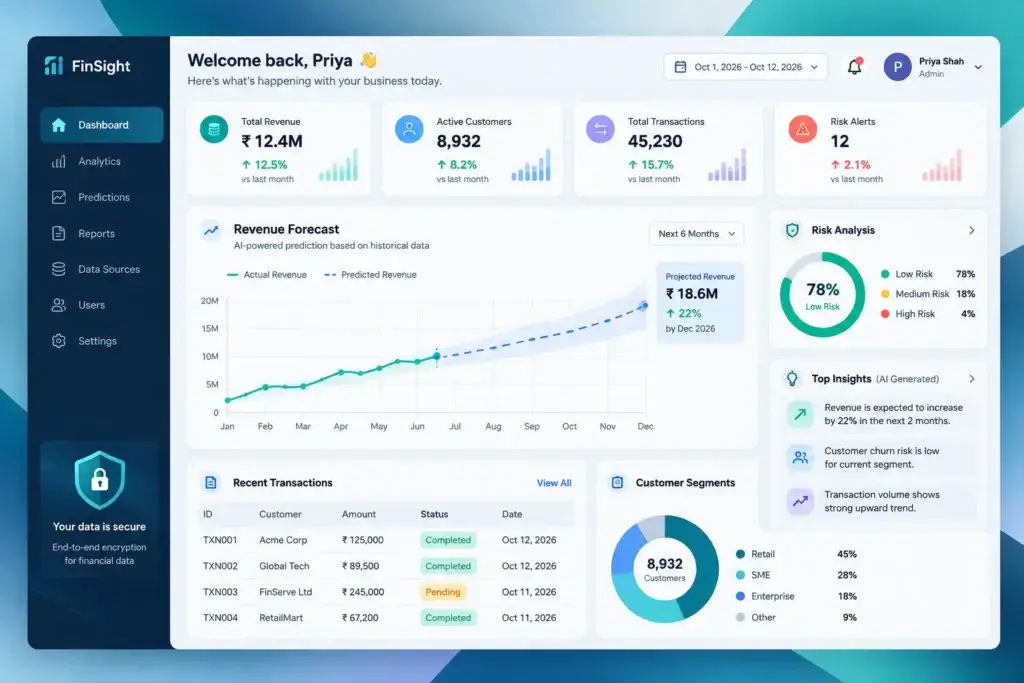
Tailoring the dashboard to specific workflows can eliminate the overhead of generic solutions. Custom pipelines often:
- Skip unnecessary data transformations, delivering fresher insights.
- Serve models close to the data source, reducing latency and operational costs.
- Implement focused security measures that satisfy regulatory demands without excess complexity.
A purpose‑built Python AI business intelligence dashboard therefore tends to demonstrate value faster than off‑the‑shelf products that require extensive configuration.
Should security be built into data modeling for e‑commerce BI?
Yes. E‑commerce platforms handle personal identifiers, payment details, and behavioral data. Embedding security at the data‑model level—through column‑level encryption, tokenization, and strict access controls—helps prevent exposure during storage and API delivery. Applying privacy‑preserving techniques before feeding data into machine‑learning models also protects user confidentiality while still enabling predictive analytics.
Learn more about Business intelligence services.
Key Takeaways
- Begin with well‑defined KPIs and data sources before coding.
- FastAPI’s async architecture and auto‑generated docs make it ideal for scalable BI backends.
- Predictive analytics adds forward‑looking context to fintech and e‑commerce decisions.
- Tableau, Power BI, Looker, and Plotly/Dash are the most common Python‑compatible visualization options.
- Security should be woven into data modeling, API design, and model serving to meet compliance needs.
Frequently Asked Questions
How do I start a FastAPI project for a BI dashboard?
Install FastAPI and Uvicorn, create a main.py with routes for data retrieval and prediction, and run the server with uvicorn main:app --reload. Use Pydantic models for validation and connect to your database with an async driver such as asyncpg.
What type of machine‑learning model works well for fintech predictions?
Tree‑based models like XGBoost or LightGBM handle heterogeneous financial features and provide interpretable importance scores. For time‑series forecasts, Prophet or LSTM networks can capture seasonal patterns in transaction volumes.
Can I deploy the dashboard on a public cloud without compromising data security?
Yes. Deploy the FastAPI container to a managed Kubernetes service, enforce TLS, apply network policies, and store secrets in a cloud‑native vault. Pair this with role‑based access in your BI tool to restrict who can view sensitive dashboards.
How often should the predictive model be retrained?
Retraining frequency depends on data drift. In fintech, a monthly or quarterly schedule is common, but monitoring performance metrics can trigger retraining when accuracy declines.
What monitoring should I add to the FastAPI service?
Instrument the API with Prometheus metrics for request latency, error rates, and resource usage. Use Grafana dashboards to visualize health and set alerts for threshold breaches, ensuring the Python AI business intelligence dashboard remains reliable.
